Understanding Your InBody Results
- Amanda Charpentier
- Jul 8, 2024
- 3 min read
First let’s understand what the InBody machine does. The InBody uses bioelectric impedance to analyze your body's composition. This method sends a small current through the body. Follow along on your own InBody sheet or on the attached picture (:
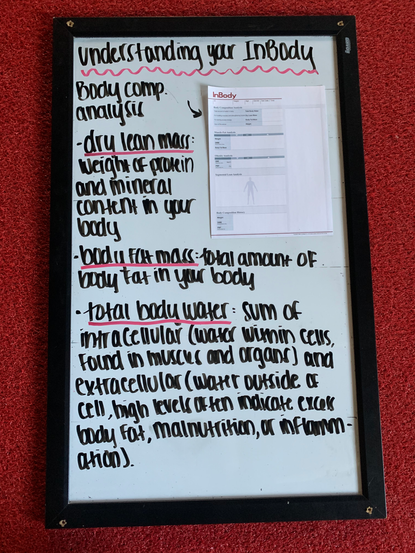
The first section labeled “Body Fat Mass” shows you quite a few metrics. Intracellular water is the body water inside of cells and extracellular of course is the inverse. Why do we care about this? If you see extracellular water increase but not intracellular this could be acute inflammation from training. Dry lean mass is the weight of the protein and mineral content in your body. Because we know that protein is the main makeup of muscle, if we see this number increasing we have most likely gained muscle. The body fat mass reveals how much total body fat you have (this number is in the next section as well).
The second section “Muscle-Fat Analysis” you will see your weight, skeletal muscle mass, and body in comparison to a healthy range of people with the same gender and height. Here you get a clearer understanding of what your body composition is. The three major components are weight (this is your total bodyweight), skeletal muscle mass (SMM can be grown through exercise), and body fat mass (how much total body fat you have).
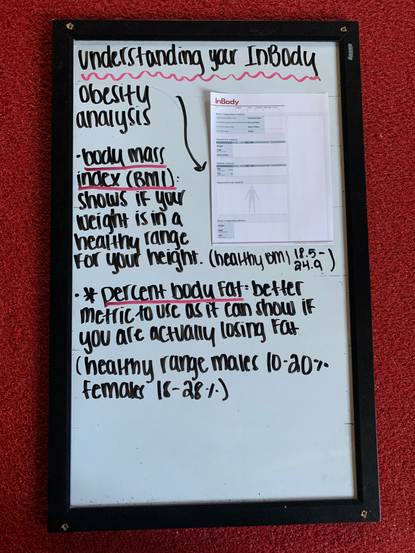
The “Obesity Analysis” gives you your BMI (body mass index). This shows you if your weight is in a healthy range for your height. A healthy BMI is around 18.5-24.9. The more important part of this section however is your PBF (percent body fat). BMI can oversimplify things, whereas PBF gives you more context and can show if you are actually losing fat and not just weight. Healthy ranges of PBF for men are 10-20% and for women 18-28%.
*Tracking progress tip: When using the Inbody, to head towards a goal of losing fat and building muscle, you should be seeing a gradual increase in skeletal muscle mass and decrease in fat mass.
The “Segmental Lean Analysis” can be helpful for a variety of reasons. It shows your lean body mass (fat free mass) in all your different body segments. This can help you see certain muscle imbalances or areas for improvement. The top line shows you how much lean body mass (LBM) you have in pounds for each body area. The top bar of the segmental lean analysis compares your composition to the average expected for your height. The goal is to be at 100% or higher here. The bottom value compares your own LBM to your own weight. This indicates if you have enough muscle mass to support your body. 100% is sufficient for this section.
“Body Fat-Lean Body Mass Control” makes it easy for you to set health goals. The result sheet will automatically calculate how much fat mass you should lose and how much LBM you should increase by to achieve your desired PBF.
Just below that is the “Segmental Fat Analysis”. This helps you look more specifically at your different body segments and the improvements or changes that are occurring. “Basal Metabolic Rate” or BMR is the calories you need for your basic functions. This is NOT how much you should be eating a day as this number does not take into account all of the activities you are doing such as working out or taking walks.
Finally let’s look at the chart in the top right hand corner “Visceral Fat Area”. There are two types of body fat; subcutaneous and visceral. The chart helps you look at how much unhealthy or harmful visceral fat you have. You want to try and stay below the 100 line.
*Training tip: Regular aerobic (cardio) exercise can help with losing visceral fat.
Final Thoughts
That was a lot of fitness talk! To keep it simple, continuing to build muscle, staying active, and following a healthy eating plan that works for you will keep you working towards your goals. Looking at those metrics like percent body fat, obesity analysis, and mass control will keep you informed on where your body composition is headed. Of course, ask one of us trainers if you have any questions regarding InBody or how to reach your fitness goals!


Comments